Telemetry pipeline (Local)
Use case
We have a telemetry pipeline that collects data from different sources and sends it to a central location for analysis (hopefully 😅). The pipeline consists of several components, including data collectors, load balancer, data aggregators, storage systems and UI for analysis. We want to set up a local version of the pipeline for testing and development purposes.
One possible solution
See the companion repository: telemetry-pipeline
Components
- Data collector: This component collects and preprocesses data from different sources and sends it to the load balancer. In this case, we will use Vector
- Load balancer: This component receives data from the data collector and distributes it to the data aggregators. In this case, we will use Nginx
- Data aggregator: This component receives data from the load balancer and sends it to the storage system. In this case, we will use Vector following the Aggregattor architecture which provides higher availability and scalability
- Storage system: This component receives data from the data aggregator and stores it for later analysis. In this case, we will use O2 and VictoriaMetrics
- UI for analysis: This component provides a user interface for analyzing the data stored in the storage system. In this case, we will use Grafana and OpenObserve
Architecture
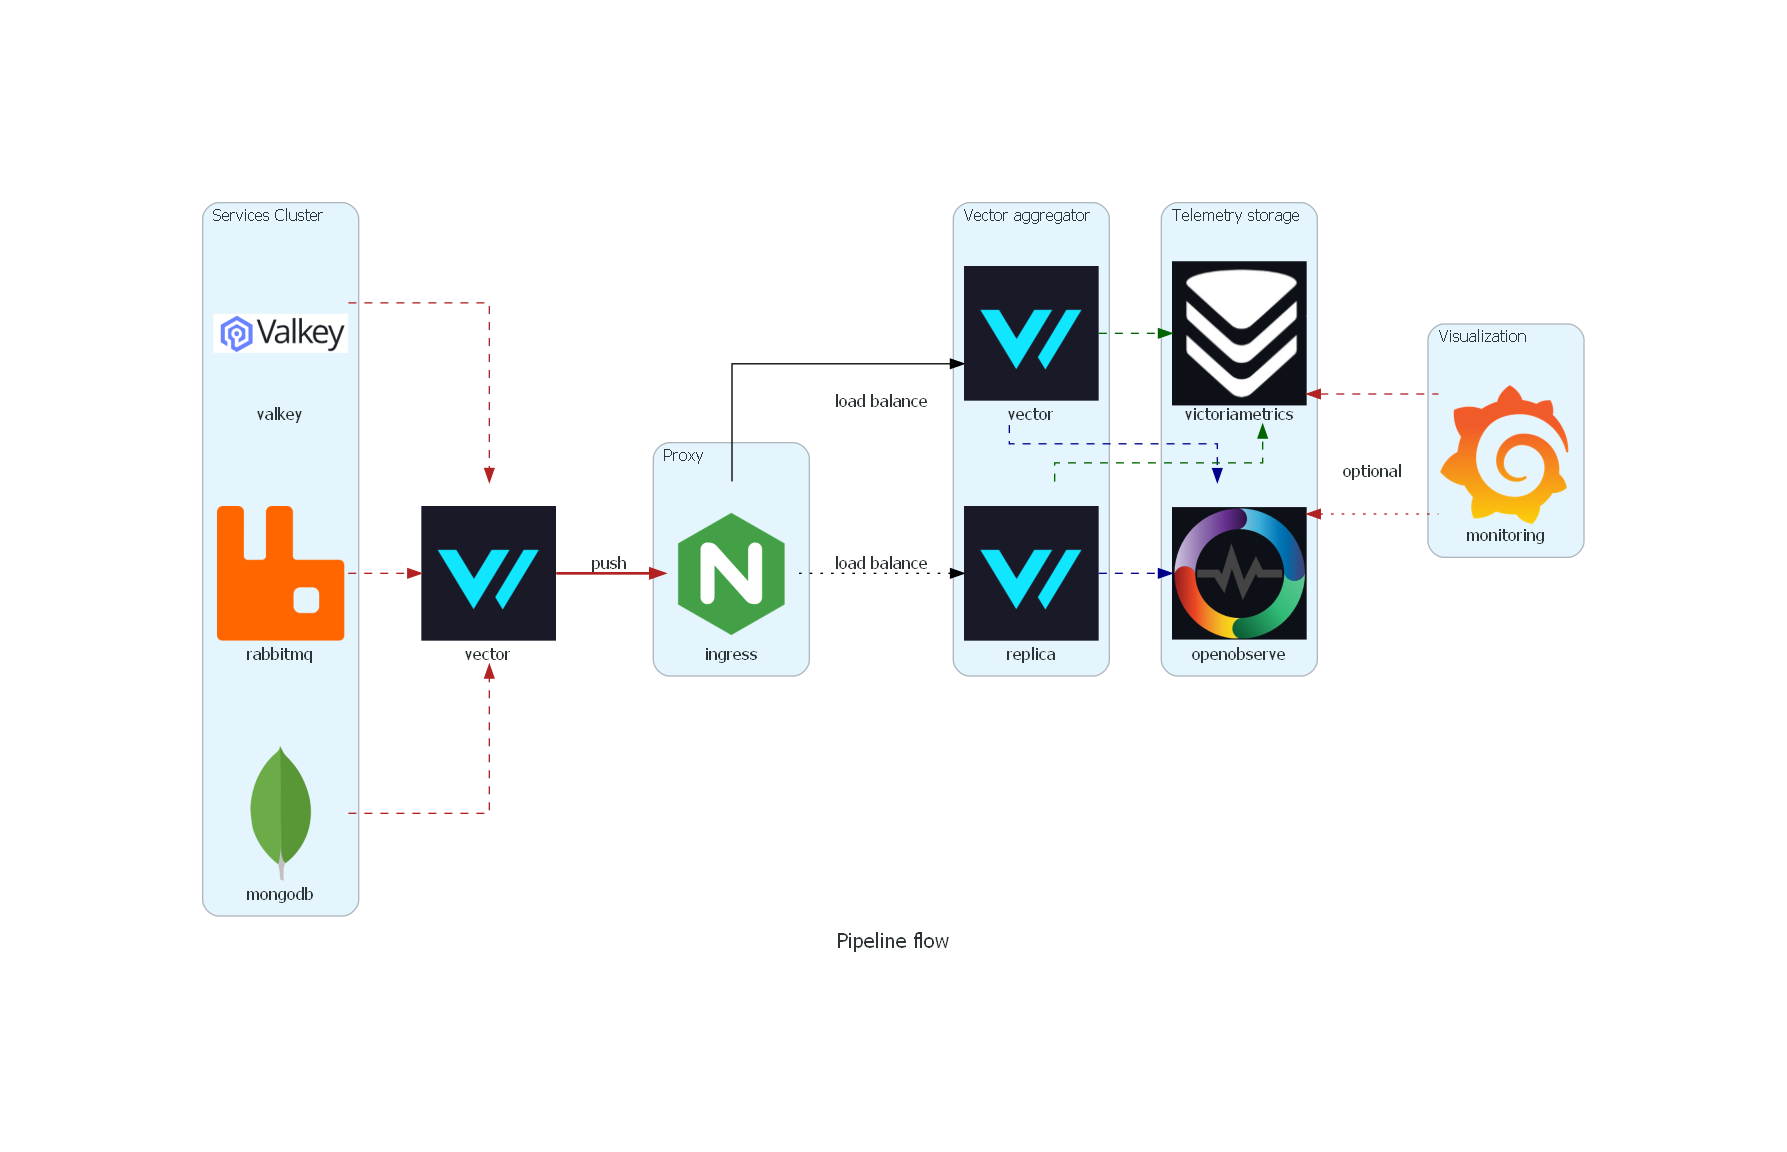
The data flow is as follows:
- Data collector collects logs from different sources, which are docker containers in this case. It also scrapes metrics exposed by the containers, mainly in the Prometheus format. Before sending the data to the load balancer, it preprocesses it and adds some metadata to it.
- The load balancer receives the data from the data collector and distributes it to the data aggregator. In this specific scenario, we are using the vector sink to send the data to the aggregator so the protocol used is gRPC.
- Data aggregator receives the data from the load balancer and sends it to the storage system. We want to keep this component as simple as possible, data preprocessing is done in the data collector. The only responsibility of the data aggregator is to receive the data and send it to the storage system (It might need to have credentials to send the data to the storage system).
- Storage system receives the data from the data aggregator and stores it for later analysis. Here we configure data retention
-retentionPeriod=14dfor VictoriaMetrics and environment variables for O2 to enable local storage e.g.ZO_LOCAL_MODE_STORAGE=disk,ZO_LOCAL_MODE=trueandZO_NODE_ROLE=all. - UI for analysis provides a user interface for analyzing the data stored in the storage system. In this case, we are using Grafana and OpenObserve. Grafana is used to visualize the data stored in VictoriaMetrics and OpenObserve is used to visualize the data stored in O2. Both tools provide a powerful user interface for analyzing the data and creating dashboards. The dasboards are slightly modified version of the ones published in grafana, the modifications are mainly to adapt the metric names to the ones used by Vector.
Running the pipeline
Prerequisites
- Docker installed
- Docker Compose installed
- cfssl optional: used to generate self-signed certificates
Steps
- Clone the repository
- Generate self-signed certificates (optional)
1
2
3
cd /certs
cfssl genkey -initca csr.json | cfssljson -bare ca
cfssl gencert -ca ca.pem -ca-key ca-key.pem csr.json | cfssljson -bare cert
- Run the pipeline
1
docker compose up -d - Access the UI for analysis
The UI(s) are served via nginx, this streamlines certificate management and allows us to use a single port for all the services. The services are served on port 8082, consider though the potential resource requirements for nginx, adding keepalive option for each upstream block in the nginx configuration can help reduce the number of connections to the backend services. This is particularly useful when using self-signed certificates, as it reduces the overhead of establishing new connections for each request (according to copilot XD)
To access the different UI(s) use the following URLs:
- Grafana: https://localhost:8082/grafana and login with the credentials, i.e. the values of the environment variables
GF_SECURITY_ADMIN_USERandGF_SECURITY_ADMIN_PASSWORD - OpenObserve: https://localhost:8082/openobserve and login with the credentials, i.e. the values of the environment variables
ZO_ROOT_USER_EMAILandZO_ROOT_USER_PASSWORD - VictoriaMetrics: https://localhost:8082/victoriametrics to check VMUI, I recommend to play with the cardinality explorer to check the number of unique values for each metric. This is a good way to check if the data is being sent correctly and if the metrics are being scraped correctly.
- RabbitMQ: https://localhost:8082/rabbitmq and login with the credentials, i.e. the values of the environment variables
RABBITMQ_DEFAULT_USERandRABBITMQ_DEFAULT_PASS
Bonus
Collect and send telemetry using Opentelemetry collector
Although not mentioned in the architecture diagram, the pipeline also uses Opentelemetry collector to collect telemetry data from the different services and send it directly to the sinks, in this case only Openobserve but in can be easily configured to push data to other sinks. Caveats Some receivers do not work properly on WSL2, also metrics names are not compatible with many of the published Grafana dashboards.
Using docker to test before deploying on Kubernetes
Troubleshooting and testing the pipeline using docker compose is a good way to test the pipeline before deploying it on Kubernetes (even kind). It really helps to understand how the different components interact with each other and, specially, how to configure them.
Network Introspection of the pipeline
Using Kyanos
Using Kyanos to introspect the network traffic of the pipeline. Kyanos is an eBPF-based network issue analysis tool that enables you to capture network requests, such as HTTP, Redis, and MySQL requests, yes you read it right L7 with eBPF
Running the following command can identity the slowest requests in the pipeline:
1
2
# considered increasing the time to catch more requests
sudo kyanos stat --slow --time 10
The TUI will show something like this:

Scrapping the RabbitMQ metrics takes a whooping (and fortunately constant) ~35ms. You might also see requests from vector aggregator to openobserve here (interesting considering that the data has been compressed)
Increasing granularity with TraceeShark
Traceeshark brings the world of Linux runtime security monitoring and advanced system tracing to the familiar and ubiquitous network analysis tool Wireshark. Using Traceeshark, you can load Tracee captures in JSON format into Wireshark, and analyze them using Wireshark’s advanced display and filtering capabilities
After tracing the pipeline with Tracee, you can load the JSON file into Wireshark and analyze it using Wireshark’s filtering capabilities. Filtering by event name and process name (tracee.eventName == "net_packet_raw") && (tracee.processName == "erts_sched_2") you will see many packets from RabbitMQ to Vector being retransmitted
75055 3.711563231 TCP e798c7cf4174 1 20 erts_sched_2 33 net_packet_raw writev 172.18.0.8 172.18.0.13 [TCP Retransmission] 15692 → 40404 [PSH, ACK] Seq=7241 Ack=187 Win=65024 Len=7240 TSval=3992918735 TSecr=2436525398
This is also an interesting result considering that both containers shared the same docker network.